-
 About Us
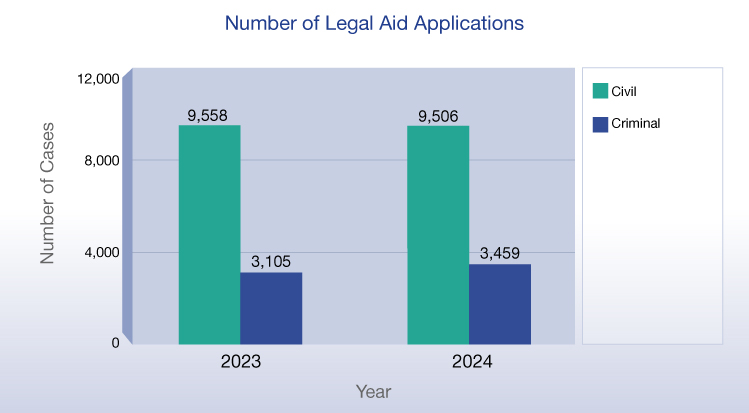
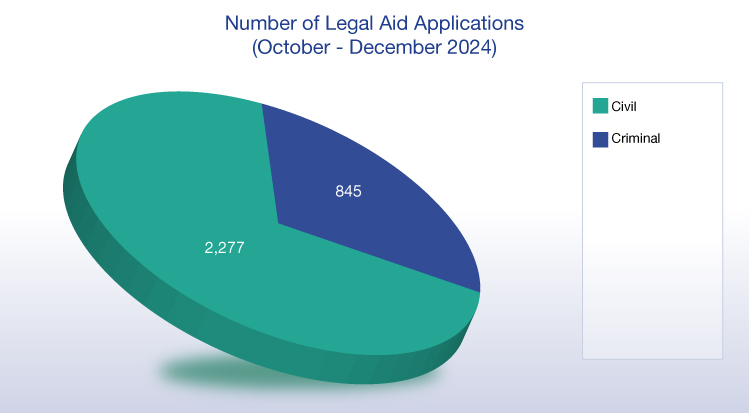
Number of Legal Aid Applications
Number of Legal Aid Certificates
Number of refused applications
Breakdown of Legal Aid Applications of Civil Cases by Different Types
Breakdown of Legal Aid Certificates of Civil Cases by Different Types
Breakdown of Legal Aid Applications of Criminal Cases by Different Levels of Court
Breakdown of Legal Aid Certificates of Criminal Cases by Different Levels of Court
Number of Applications and Certificates under the Supplementary Legal Aid Scheme
Outcome of Civil Cases Closed
Legal Aid Costs Expended, Damages and Costs Recovered
Analysis of Legal Aid Costs by Nature of Expenditure
Distribution of Legal Aid Assignments to Legal Aid Practitioners
Number of case assignments handled by top 10 Legal Aid Practitioners
Number of suspected champerty cases reported to Police
Number of Regulation 11 Order issued
Number of cases where DLA’s discretion is exercised
| Civil | Criminal | Total | |
|---|---|---|---|
| 2021Q1 | 2 737 | 796 | 3 533 |
| 2021Q2 | 3 216 | 835 | 4 051 |
| 2021Q3 | 3 154 | 764 | 3 918 |
| 2021Q4 | 2 768 | 814 | 3 582 |
| 2021 | 11 875 | 3 209 | 15 084 |
| 2022Q1 | 1 772 | 519 | 2 291 |
| 2022Q2 | 2 553 | 773 | 3 326 |
| 2022Q3 | 2 593 | 737 | 3 330 |
| 2022Q4 | 2 562 | 720 | 3 282 |
| 2022 | 9 480 | 2 749 | 12 229 |
| 2023Q1 | 2 357 | 713 | 3 070 |
| 2023Q2 | 2 479 | 780 | 3 259 |
| 2023Q3 | 2 393 | 787 | 3 180 |
| 2023Q4 | 2 329 | 825 | 3 154 |
| 2023 | 9 558 | 3 105 | 12 663 |
| 2024Q1 | 2 233 | 792 | 3 025 |
| 2024Q2 | 2 404 | 917 | 3 321 |
| 2024Q3 | 2 592 | 905 | 3 497 |
| 2024Q4 | 2 277 | 845 | 3 122 |
| 2024 | 9 506 | 3 459 | 12 965 |
| 2025Q1 | 2 140 | 891 | 3 031 |
| 2025Q2 | 2 158 | 1 018 | 3 176 |
| 2025Q3 | 2 281 | 1 088 | 3 369 |
| 2025Q4 | 2 057 | 1 038 | 3 095 |
| 2025 | 8 636 | 4 035 | 12 671 |
| 2026Q1 | 2 558 | 1 070 | 3 628 |